Operational visibility for routes, latency, and incidents
TraceLog gives your NOC clear evidence on route changes, latency degradation, packet loss, and historical context so your team can isolate incidents before they escalate.
Route intelligence
Visibility that explains where the problem starts
From hop mapping to latency history and secure integrations, TraceLog turns measurements into operational context for your NOC.
Path & Hop Analysis
Map every hop in real-time. Detect routing loops, identify silent transit failures, and set alerts for hop count limits.
Load Balancing & Loops
Distinguish between normal load balancing (consecutive/diamond patterns) and critical routing loops (cyclic patterns).
Latency & Precise Jitter
Monitor RTT and calculate Jitter using RFC 3550 standards. Define latency limits to catch degradation before it impacts users.
Team isolation and RBAC
Organize your structure into teams with strict data boundaries, delegated permissions, and isolated operational access.
Dual-Stack Monitoring
Native support for IPv6 and IPv4. Test connectivity on both protocols simultaneously.
Intelligent Triggers
Advanced rules based on Routing Loops, TTL limits, and custom latency thresholds to eliminate false positives.
Maintenance Windows
Silence alerts during interventions without stopping telemetry collection.
Native Webhooks
Integrate via POST JSON with HMAC security for incident automation.
Optional Agente NOC Compatibility
Customers using Agente NOC can access TraceLog telemetry, statistics, and route context directly from the agent experience.
A panel your NOC can actually read under pressure
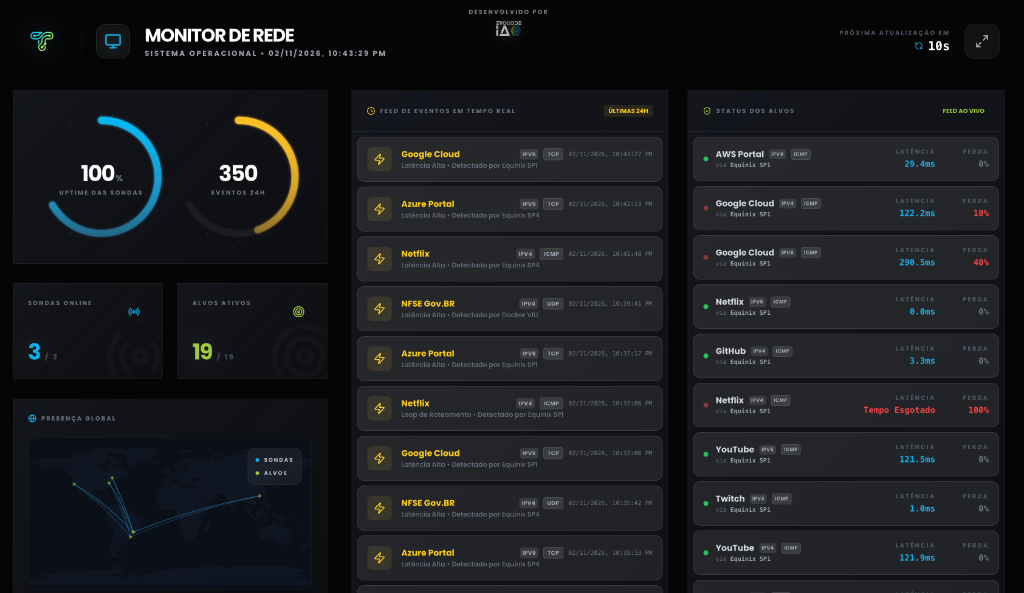
TraceLog includes a native operational interface with TV mode, route evidence, and high-density incident context for teams that need fast decisions without stitching together multiple dashboards.
- High-contrast layout for wallboards and NOC monitors
- Automatic real-time updates with incident context
- Integrated map and route evidence in the same view
- Recent event history without manual correlation
Context, evidence, and optional compatibility in one operating flow
TraceLog centralizes route changes, latency history, incident timelines, and per-target evidence in a single operational layer. For teams that already use Agente NOC, this same context can also be consumed from the agent without changing product ownership.
See compatibility detailsHistorical context
Compare route changes, latency history, and incident evidence before and after the impact.
Operational statistics
Keep probe health, target performance, and recent traces visible in the same operating layer.
Optional Agente NOC compatibility
Customers who already use Agente NOC can consult TraceLog telemetry and route context from the agent.
Secure collection
Remote probes, signed integrations, and team isolation
Deploy probes close to your users, expose evidence securely through API and HMAC webhooks, and keep operational access segmented by team.
- Deploy in secondsSimplified installation via Docker or Python script.
- Signed integrationsHMAC webhooks and scoped API access keep automations connected without exposing the platform.
- Operational isolationTeams and RBAC preserve customer context, permissions, and data boundaries across the operation.
# Install your probe in seconds
docker run -d --name tracelog-probe \
-e SENSOR_KEY=your_key_here \
-e API_BASE_URL=https://tracelog.evocode.ia.br/api \
evocodeia/tracelog-probe:latest
Real Advantages
The end of "everything is normal here"
Social Proof
Who uses, trusts
“Since we implemented TraceLog, our response time for route incidents has dropped by half. The visibility is impressive.”

Ricardo Oliveira
“Remote probes are the big differentiator. We can see the network exactly like our customers in different regions.”

Amanda Santos
“Excellent tool for troubleshooting. Historical ASN logs helped us solve complex transit issues.”

Felipe Amaral
“Intuitive interface and accurate data. TraceLog became indispensable for our daily monitoring.”

Beatriz Souza
Transparent Pricing
Choose the ideal plan
Raw latency and route measurements are kept for a minimum technical period required to produce the monthly SLA report, even on plans with a shorter window. See the Privacy Policy for details. Read our Privacy Policy